

New Listings Hit a Four Month High While Pending Sales Fell 3.1% in Late August, Redfin Reports
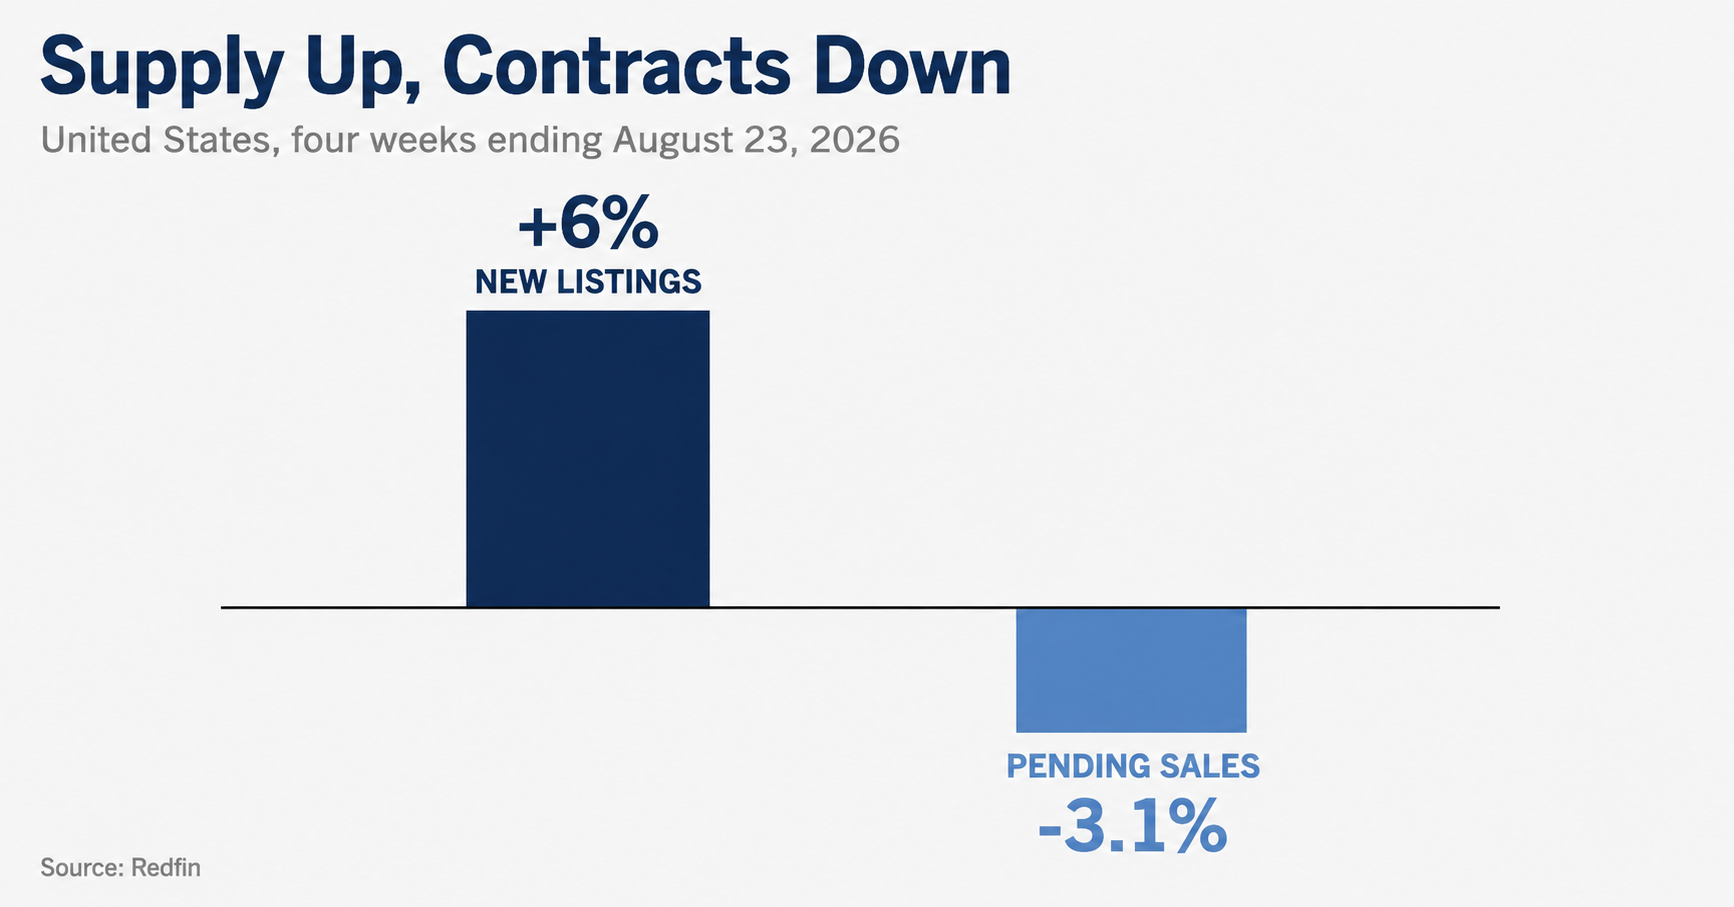
New listings rose 6% year over year in the four weeks ending August 23, 2026, while pending sales fell 3.1% to their lowest level since February.
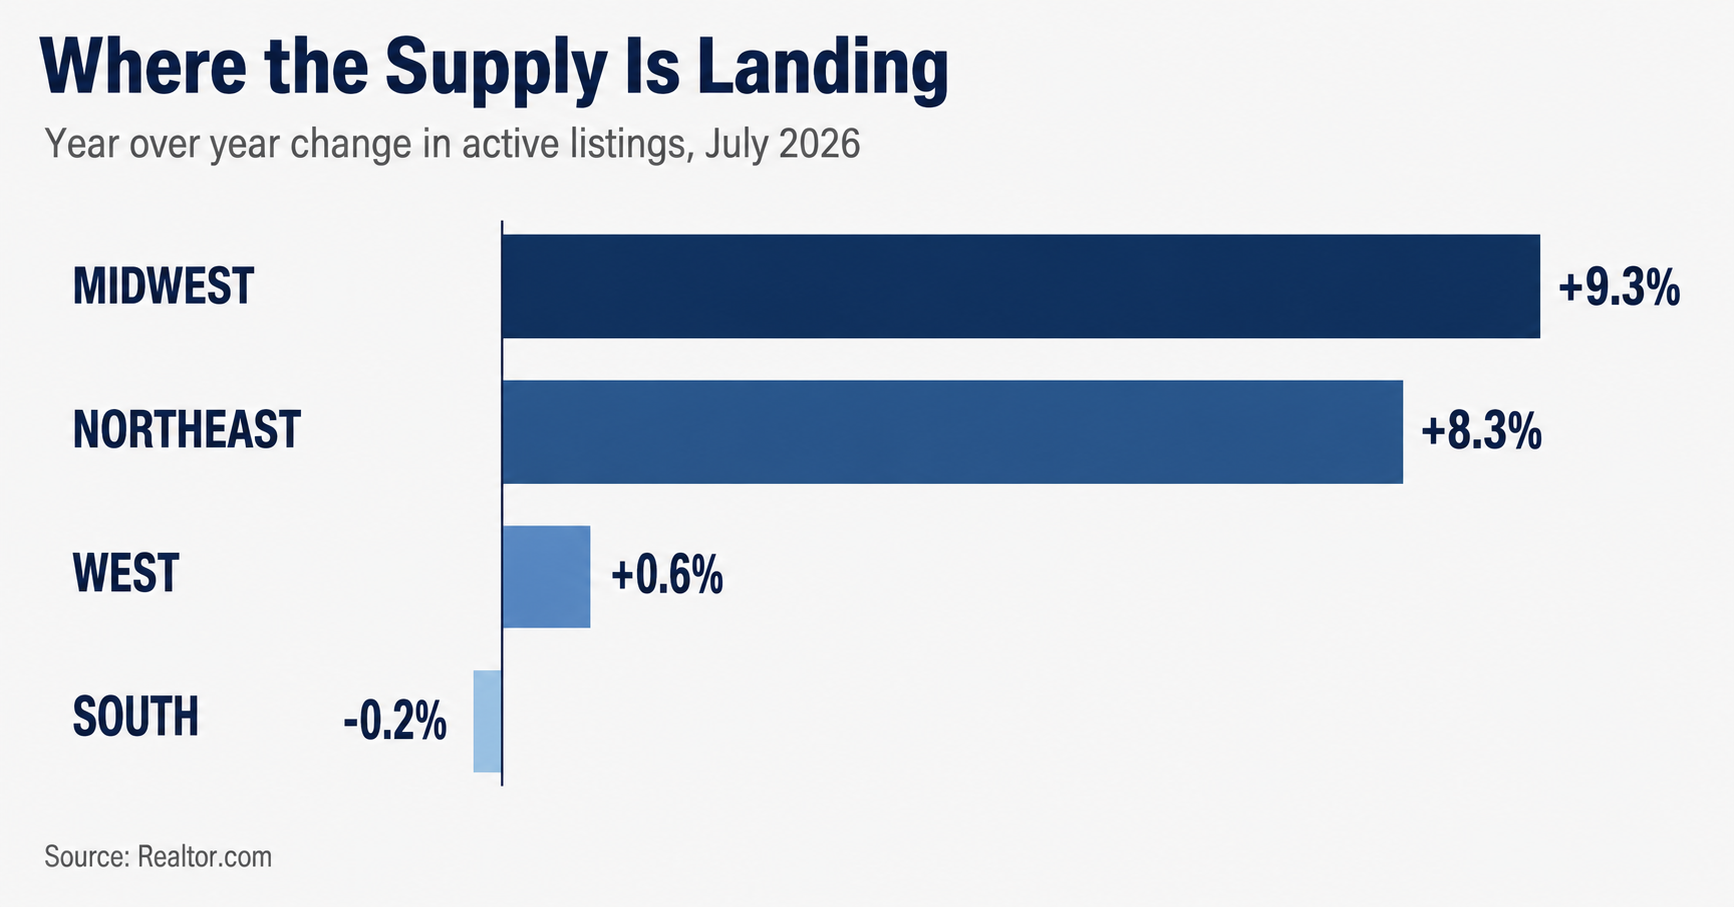
Housing inventory grew fastest in the Midwest and Northeast in July 2026, while the South declined and the West was nearly flat.
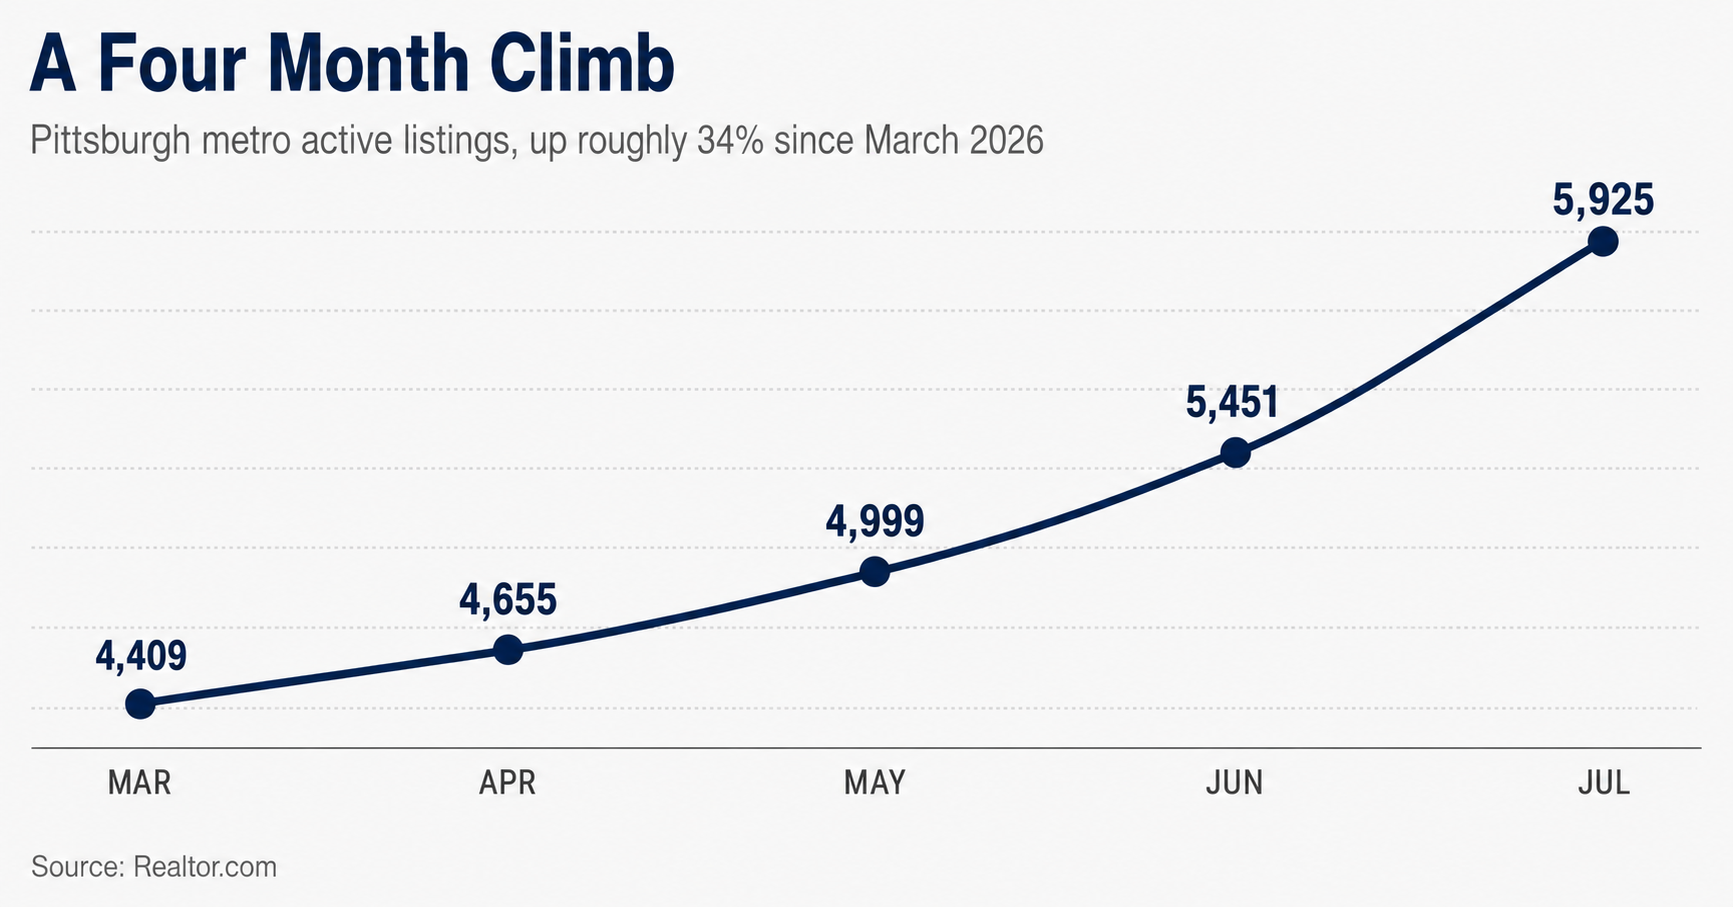
Active listings in the Pittsburgh metro rose from 4,409 in March 2026 to 5,925 in July, an increase of roughly 34% across four months.
Supply kept building through the late summer in a market where 30 year mortgage rates remain near 6.7%, while buyer activity moved the opposite direction.
Redfin data for the four weeks ending August 23 shows new listings up 6% from a year earlier, the highest level since April, while active inventory rose week over week. Pending sales moved the other way, falling 3.1% year over year to their lowest level since February. Sellers came to market. Buyers did not match the pace.
Realtor.com's weekly series shows the same widening. Active listings were up 4.0% year over year for the week ending August 22, roughly double the 2.1% annual growth recorded for July as a full month. The build is not a leftover from spring. It gained speed through August.
The monthly data underneath that trend explains where the supply is landing. Realtor.com's July Monthly Housing Trends Report put national active listings at 1,126,252. Midwest inventory rose 9.3% year over year and the Northeast rose 8.3%, while the South fell 0.2% and the West added 0.6%. That ranking is close to the mirror image of 2024 and 2025, when inventory growth was led by the South and West. Gains appeared in 34 of the 50 largest metros, led by Minneapolis at 29.3%, Louisville at 24.9% and Seattle at 21.4%. Jacksonville fell 20.0%, Miami fell 16.9% and San Francisco fell 16.3%.
Florida illustrates why inventory counts need context. Cape Coral and Punta Gorda both carried median marketing times near 94 days in July, among the slower paces in the country, even though active inventory in both metros was down more than 20% from a year earlier. Homes there were selling faster than they did last July, and Florida closed sales rose. Falling listing counts in those markets cannot be read as sellers simply withdrawing.
Pittsburgh sits near the front of the opposite pattern, and its trajectory is the clearer signal. Realtor.com counted 5,925 active listings in the metro in July, up 16.2% year over year at a median of 50 days on market, about the same pace as last year. The month by month climb matters more than the annual comparison. Active listings moved from 4,409 in March to 4,655 in April, 4,999 in May, 5,451 in June and 5,925 in July, an increase of roughly 34% across four months, with July alone adding 8.7% over June. Zillow's July metro data shows inventory up 15.7% while its home value index slipped 0.2%, consistent with available supply growing considerably faster than prices.
Louisville, Indianapolis, Cincinnati and Cleveland show variations of the same inventory building pattern, though the magnitude and the market response differ considerably by metro. What links them is a starting point. These are markets that spent the post-pandemic years among the tightest in the country. When supply returns to a market that never had a glut, the change registers in listing counts well before it registers in price, which is what Pittsburgh's flat days on market alongside a slightly negative value index describes.
Financing cost is the reason supply accumulates instead of clearing. Freddie Mac put the 30 year fixed rate at 6.66% on August 27, up slightly from 6.65% a week earlier. The backward comparison matters more. The same survey read 6.56% a year ago and roughly 6.01% in February. Listings are building into a market where borrowing costs rose over the past six months rather than eased.
Inflation is holding that floor in place. The Bureau of Labor Statistics reported consumer prices up 3.4% over the 12 months ending in July, down from 3.5% in June but still above the Federal Reserve's 2% target. Core prices rose 2.5%. Shelter, running 3.2% year over year, accounted for roughly two thirds of the monthly increase. Wage growth tracked at 3.2% over the same period, slightly behind inflation, so buyer purchasing power did not improve while listings climbed.
National inventory remains 11.6% below typical 2017 to 2019 levels, meaning the market is absorbing this supply from a thin base. Where listings keep rising and contracts keep slipping, the gap sits on the market rather than closing.
About Buys Houses
For homeowners, the practical question is which side of the split their market sits on. In the metros building inventory, competition among sellers is real for the first time since 2020, and condition, pricing accuracy and time to close carry more weight than they did a year ago. Homes needing work draw a narrower buyer pool than turnkey listings, even where overall demand is holding. That gap is where the housing market softening in 2026 shows up first, and the company blog tracks what it means through the rest of the year.
Buys Houses is a cash home buying company serving Allegheny, Washington, Beaver and Westmoreland counties in western Pennsylvania. Owners searching for we buy houses in Pittsburgh options most often hold inherited homes, vacant properties, tenant-occupied rentals or houses needing repair. The company purchases those in as-is condition, with no requirement to stage or complete work before closing.
Homeowners weighing a sale can request a no obligation cash offer and compare it against a traditional listing before deciding. The we buy houses route trades a listing period for a set closing date.
Carlo Finotti
Buys Houses
+1 412-561-9833
media@BuysHouses.co
Visit us on social media:
LinkedIn
Instagram
Facebook
YouTube
Other
Legal Disclaimer:
EIN Presswire provides this news content "as is" without warranty of any kind. We do not accept any responsibility or liability for the accuracy, content, images, videos, licenses, completeness, legality, or reliability of the information contained in this article. If you have any complaints or copyright issues related to this article, kindly contact the author above.
