

Existing-Home Sales Fell 2.4% in June as the Median Price Set a Nominal Record, NAR Reports
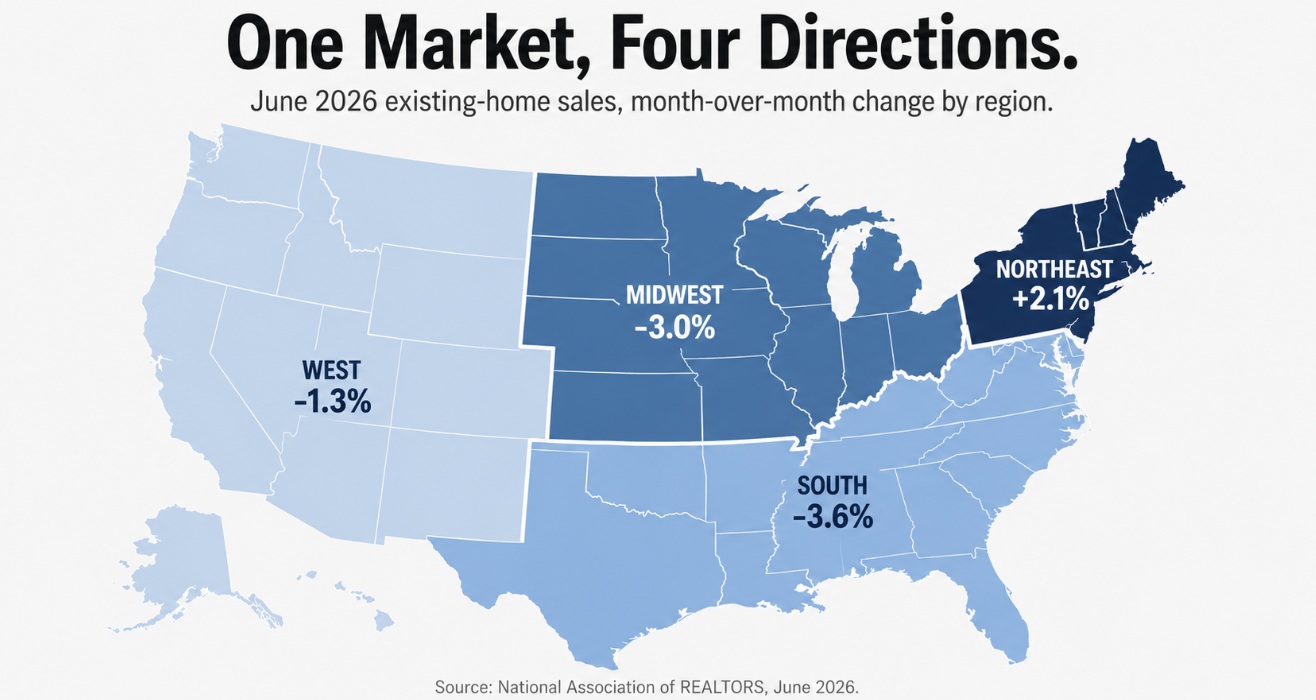
Existing-home sales moved in different directions across US regions in June 2026, rising in the Northeast while falling in the Midwest, South, and West.

The number of affordable US housing markets fell from 354 in 2014 to 212 in 2025, with highly affordable markets dropping from 41 to four.
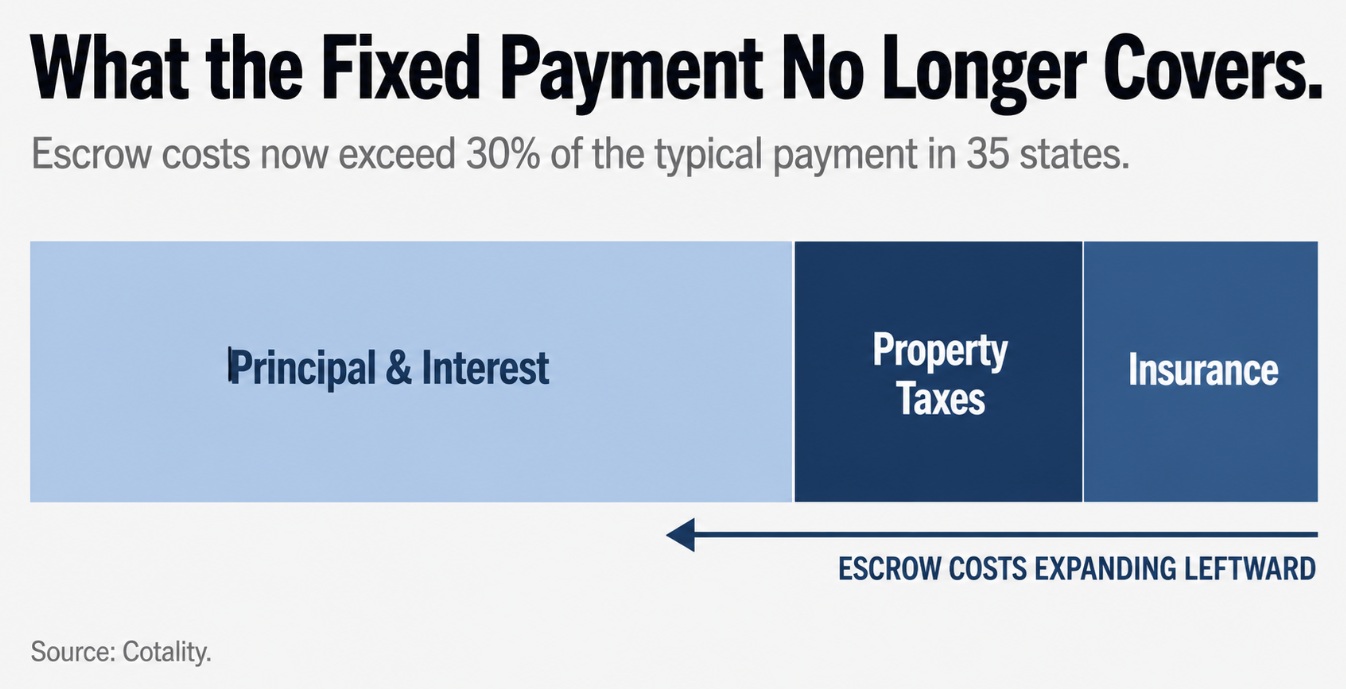
Property taxes and homeowners insurance now consume 30% or more of a typical monthly mortgage payment in 35 states, leaving less room for principal and interest.
June interrupted May's gains in three of four regions, as rising tax and insurance costs widen the gap between a home's list price and its cost to own.
Falling sales and a record median are not inherently at odds. They measure different things. Sales count how many transactions closed. The median marks the midpoint of the homes that sold, and it can climb when fewer lower-priced homes change hands.
May's Regional Gains Partly Reversed in June
In May, sales rose across most of the country, led by a 6.4% monthly jump in the Midwest. June gave part of that back. Midwest sales fell 3.0% and Southern sales fell 3.6%, while the West softened from flat to a 1.3% decline. The Northeast rose in both months, about 2% each time.
This looks more like monthly volatility than a new trend. A region that rises 6.4% and then falls 3.0% still sits roughly 3% above where it started. June interrupted May's improvement without setting a new direction.
The year-over-year picture was steadier. Sales were higher than a year earlier in the Midwest, South, and West in both months, with the Northeast the persistent laggard, improving from an 8% annual decline in May to flat in June.
Pending sales, a leading indicator, rose 3.8% in May, yet June closings still fell. That gap may reflect timing, failed contracts, or May deals set to close in July. The June pending figure, due July 16, will say more.
NAR chief economist Lawrence Yun tied the month-to-month movement to how sharply buyers react to small changes in mortgage rates. He argued that continued job growth should support demand, and noted that affordability improved from a year ago. His stated concern is inventory. If supply growth stalls, the affordability gains may not hold.
Why Buyers React to Small Rate Moves
The average 30-year rate rose only modestly in June, from 6.44% to 6.49%, and sat well below the 6.82% of a year earlier. A move that small does not, by itself, explain a 2.4% sales decline. Part of the drop likely reflects May's strength unwinding, thinner inventory, and ordinary monthly noise.
But rate sensitivity is amplified by what sits alongside principal and interest. A monthly payment also carries property taxes and homeowners insurance, usually collected through escrow, and both have risen sharply. In Cotality's analysis, escrow-related costs, which include taxes, insurance, and private mortgage insurance where a loan requires it, now account for 30% or more of a typical monthly payment in 35 states. In nine states, the share reaches 40% or more. Cotality reports these costs have risen roughly 45% over five years.
When taxes and insurance take a larger share of the payment, less room remains under a lender's debt-to-income limit for principal and interest. This does not touch every buyer equally. Cash purchases made up 25% of June sales and are not bound by mortgage qualification. But for financed buyers on a fixed budget, rising escrow can turn a small rate increase into the difference between qualifying and not.
Federal Data Shows a Similar Split
The Federal Housing Finance Agency, whose index tracks repeat sales of properties financed through Fannie Mae and Freddie Mac, reported that national prices fell 0.1% from March to April 2026 and rose 2.0% over the prior twelve months. That index misses cash and jumbo sales but controls for changes in the mix of homes sold.
Beneath the flat national figure, twelve-month changes ranged from 4.4% in the East North Central division to 0.2% in the Pacific. Monthly changes ran from a 0.8% decline in the Mountain division to a 1.0% gain in New England. A national series moving less than a point conceals a four-point spread between divisions.
What the Divergence Means
The national number captures broad direction. It is a poor substitute for local inventory, price-tier, tax, and insurance conditions.
Affordability shows the same two-sided story. NAR's index improved to 102.3 in June from 95.5 a year earlier, helped by both income growth and the lower rate. But it slipped from 105.6 in May, as the higher price and rate pushed the monthly reading down.
Cotality's own affordability measure, which folds escrow into the payment, shows the longer arc. The number of affordable US markets fell from 354 in 2014 to 212 in 2025, and markets rated highly affordable dropped from 41 to four. The sharpest losses landed on the West Coast and in major Eastern hubs, while parts of the Midwest and South remain among the last places a median income still reaches a median home. The measure rests on Cotality's assumptions, so it models affordability rather than counting who can buy.
Taxes and insurance raise the cost of ownership whether paid through escrow or directly. A market can post modest price gains while its carrying costs climb fast enough to price out the buyers those gains might draw. The price a listing advertises understates the monthly obligation a buyer takes on, and that gap is widest where the FHFA and NAR figures already diverge.
About Buys Houses
Buys Houses purchases residential property directly from owners across Allegheny, Washington, Beaver, and Westmoreland Counties in western Pennsylvania. The company works with owners of inherited, distressed, and as-is properties, providing a direct alternative for sellers who would otherwise carry a home through an extended listing while taxes and insurance continue to accrue. Owners can request cash offers on their property and complete an as-is cash sale without repairs or staging. Learn more about how we buy houses across western Pennsylvania at buyshouses.co.
Carlo Finotti
Buys Houses
+1 412-561-9833
media@BuysHouses.co
Visit us on social media:
LinkedIn
Instagram
Facebook
YouTube
Other
Legal Disclaimer:
EIN Presswire provides this news content "as is" without warranty of any kind. We do not accept any responsibility or liability for the accuracy, content, images, videos, licenses, completeness, legality, or reliability of the information contained in this article. If you have any complaints or copyright issues related to this article, kindly contact the author above.
